In my previous post, I discussed the merits of administering a baseline assessment and how I interpret that data. Today, I’m looking at student demographic data as another way of creating a complete picture of who my students are. While it doesn’t sound like the most exciting way to spend an hour of planning time, it pays off by opening your eyes to the complexities of your students, as well as shines a light on your own assumptions about them.
These assumptions can come into play when making decisions based on student demographic data. It’s important to keep our own biases about various types of people in check and try to be as objective as possible. It’s not about validating stereotypes – it’s about using the data to find ways to best serve students. When looking at this type of data, I’m always eager to “read” the numbers, look for patterns, see how they align with my expectations, and make adjustments in my teaching as needed. As I dig down into it, I keep in mind that there’s so much more than what I see in a report, and I use my investigative skills to further understand my students.
One of my colleagues, David Castaneda, has become quite adept at interpreting data. Now in his fourth year of teaching, he is currently in our district’s Induction Program to clear his Preliminary Credential. As part of this program, he has to examine his data and come up with conclusions about the significance of what he learns. I’ve shared his findings along with mine, particularly since he has a different set of lenses than I do. That being said, both David and I taught at the same school previous to this one, and both transferred here at almost the same time. It made it interesting in that we validated each other’s conclusions since we were on the same track.
With that in mind, here’s the data I compiled from all of my students.
Reported Race
This being my second year at my current school, I was unsure of the mix of races represented in my classes. In the past, I’ve had about 80% Hispanic students, with the rest of the 20% representing other races. This year, the breakdown is as follows:

My intial observations were: 1) only about half of the students here are Hispanic, 2) there are more Asian students than White, and 3) 6.1% of my students are African-American, which is up from the 1% at my previous school.
David had a similar mix of students, and was surprised by the number of Asian students at our school. Asians comprise one-third of his class, which is something he’s not accustomed to. As I mentioned before, we previously worked with a largely Hispanic population, so having so many Asians is new to us. Does this matter? Definitely!
David states:
Previously, I was able to give anecdotes to the class about my life growing up and how it shaped me to who I am today. The overwhelming majority of students in the class could relate to some of those experiences. However, with a higher percentage of an Asian population (and the Hispanic population cut in half than what I am use to), I know that may not be the case now.
I found this to be amusing because I’m having the opposite experience in that, as a Filipina, I can now better relate to my students. Luckily, I’m continualy learning about the Hispanic culture, so every once in a while I can drop a reference or two.
David further commented that:
Working back at our previous school, I could easily connect with my classes because the high percentage of them were Hispanic students like me; however, this is not the case now. Because of this, I will actively look to see how I can incorporate other cultures into my classroom. By referencing those cultures or by incorporating their language somehow to a lesson, I hope to be able to connect with more of my students. I will, also, reference my neighborhood growing up and my friends, so they know that I do have some understanding of their cultures.
I think this is very insightful and a great example of using demographic data to make the material more relevant and relatable.
Primary Language
After seeing the racial distribution of my students, I figured that there would still be at least 50% of my students speaking Spanish. Boy was I wrong!
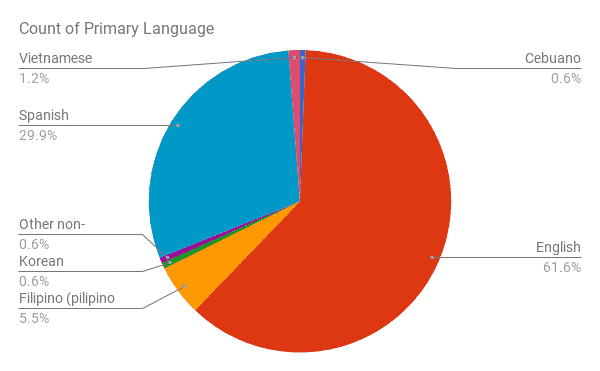
I, of all people, should know that just because a person is of a non-white race, that doesn’t necessarily mean they speak their native language. I don’t know how to speak Tagalog at all despite being Filipino – and I’m not even first generation since I was born in the Philippines! So for me to make the assumption that my students speak their native language is silly.
While I have 19.5% Asian students, only 7.9% of those claim their native language to be their primary language. There are 52.4% Hispanic students, but only 29.9% claim Spanish as their native language. Even more surprising was the fact that I have one white student who stated Filipino as their native language, and two white students that listed Spanish as their native language (and are English Language Learners). I honestly don’t know what to make of that, but I plan to investigate further.
David’s thoughts on this:
It is interesting to note that 45% of students are considered “Hispanic” yet only 25% of students speak Spanish “natively.” This implies that most parents must be second or third generation, and often times are more educated and would therefore encourage English language development.
English Proficiency
Based on the information above, I made the assumption that the majority of the students are English-only students, and that I still had English Language Learns (ELs) in my classes. I was correct!

My ELs fall into three categories: 1) English Learners (ELs), 2) Initially Fluent Proficient (I-FEP), and 3) Reclassified Fluent Proficient (R-FEP). According to the California Department of Education, ELs have not developed listening, speaking, reading, and writing proficiencies in English sufficient for participation in the regular school program. I-FEPs are students with a primary language other than English who took the California English Language Development Test (CELDT) within 30 days of enrollment in a U.S. public school and who met the Local Education Agency (LEA) criterion for English language proficiency. R-FEPs are students with a primary language other than English who were initially classified as English learners, but who have subsequently met the LEA criteria for English language proficiency.
Upon closer examination, I have 15 Asian students and 40 Hispanic students that fell within those categories. Also, 8 Hispanic students who spoke English as their primary language were identified in one of the three categories (head-scratcher).
What does this mean?
David’s analysis was intriguing:
The data that is presented is interesting. Growing up in a predominately Hispanic neighborhood, I know firsthand the reasons why some parents might not want their child to be labeled as an I-FEP, R-FEP, or EL. Some of my mother’s friends discussed doing this with her as if it was going to leave the students at some sort of disadvantage. However, what is interesting about the data from our school is that the students that speak something other than English or the students whose first language was something other than English are not EL students. Typically, students whose first language is Spanish are predominately EL students later on in life. They become “LTELS” or Long term English Learners. This is one of the reasons why many of my mother’s friends did not want their child identified as English Learners for fear that they may never remove that moniker and stay in “special” language classes.
However, at our school, it appears most of these students remove the LTEL stigma. Only 2 of my students are currently English learners while the data demonstrates that over 35% of students either spoke something else as their first language or speak another language primarily at home. This demonstrates several factors may be at play: the parents stressed learning English, their primary education succeeded into making them English proficient, and/or they had other socioeconomic advantages than students from other parts of the District. This might correlate with the population of the class because not all students are hispanic. Traditionally speaking, there isn’t as a big emphasis in language development among Spanish speaking households; while, Asian cultures prioritize learning in general.
Program Code
I already knew this from my previous analysis for my students with IEPs, but it’s still important to see:

43 students, or 26.8% of my students have an IEP. Not all of them have special accommodations; in fact, some of them are considered “speech only,” which means that they only meet with the speech therapist and aren’t in a special class.
It gets interesting when you look at when the data intersects. I have 22 students that have an IEP and are ELs. I interpret that to mean that those students will need extra help and attention because 1) they’re already struggling to access the language, and 2) they have some sort of special need that may make learning difficult.
Putting this all together
Remember how David made the decision to include different cultures to make his content more relatable? This is always a good common practice, but it’s only meaningful if you’re aware of the races and ethnicities of the students looking up at you every day. Perhaps you have a pocket of Eritrean students in your school who feel marginalized or culturally isolated. I can only imagine how validated they would feel if you asked them if they spoke Tigrinya or how they celebrate Martyr’s day!
Next week, I’ll put this together so that you can see how valuable all of this data is. Perhaps you’re already convinced, but honestly, it’s eye-opening when you see it compiled into a spreadsheet. While a student isn’t just a sum of their parts, it’s important to make a plan that can best move your students forward.
This is part of my Digging into Data series. If you’re not caught up, I encourage you to start here, and use it as a launching point for really getting to know your students!
[…] time, we’re going to look at demographics. Hope to see you […]